Identification of Sarcomatoid De-Differentiation in Renal Cell Carcinoma by Machine Learning on Multiparametric MRI
Overview
We report a machine learning approach using Self-Organizing Maps (SOM) and Learning
Vector Quantization (LVQ) to analyze multiparametric MRI for the purpose of differentiating between
renal cell carcinoma tumor with (sRCC) and without (nsRCC) sarcomatoid de-differentiation, a transformation that is
associated with poorer outcomes. The SOM+LVQ model was trained on mpMRI data from 9 nsRCC and 9 sRCC tumors, validated on a separate cohort of
3 nsRCC and 3 sRCC tumors, and tested on a held-out set of 5 nsRCC and 5 sRCC tumors. An overall classification accuracy of 70% was achieved on the test cohort.
Proposed Scheme
Suspected RCCs are not routinely biopsied prior to surgical resection; therefore the presence of sarcomatoid
de-differentiation (sRCC) is often unknown until histologic evaluation. sRCC is associated with a poor prognosis, and is therefore managed more
aggressively than renal cell carcinoma without sarcomatoid components (nsRCC).
There is a clinical need for a non-invasive method to detect sarcomatoid dedifferentiation pre-operatively, especially when considering management
options like active surveillance. We report a supervised machine learning approach to classify renal cell carcinoma (RCC) tumors based on their
appearance on T2-weighted (T2W), non-contrast T1-weighted fat-saturated (T1W), contrast-enhanced arterial phase T1- weighted fat-saturated (T1W-CEart),
and contrast-enhanced venous phase T1-weighted fat-saturated (T1W-CEven) MRI images. The model was trained on these multiparametric MRI (mpMRI) data
from 9 nsRCC and 9 sRCC tumors, validated on a separate cohort of 3 nsRCC and 3 sRCC tumors, and tested on a held-out set of 5 nsRCC and 5 sRCC tumors.
Results
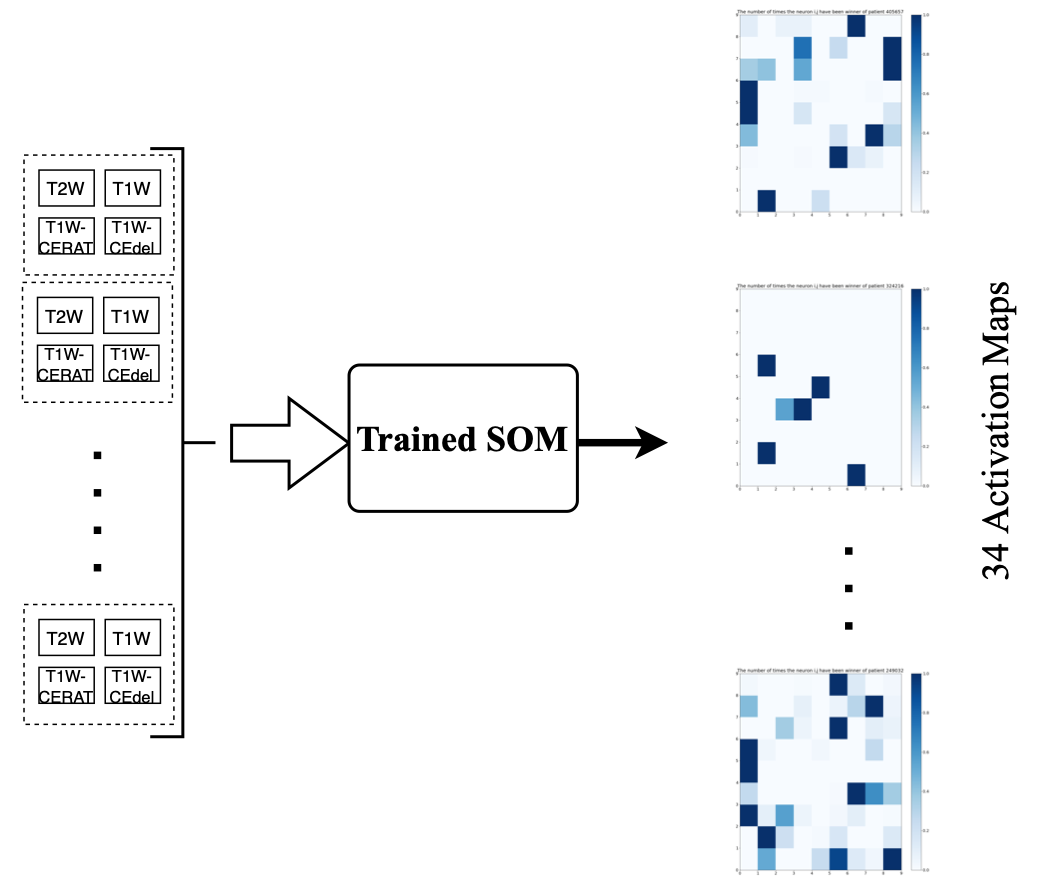
A 9x9 SOM was trained on the 18 training cohort tumors to
produce the SOM; the 81 “neurons” in the trained SOM correspond to distinct “phenotypes” in
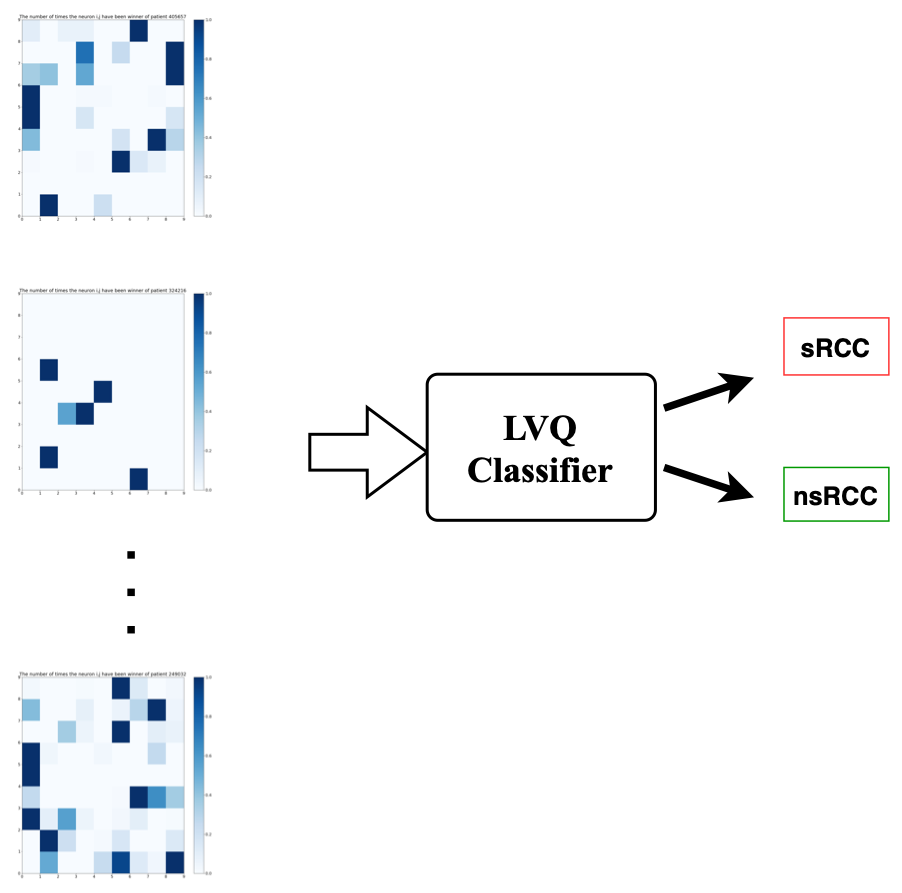
the 4-dimensional calibrated & variance-normalized intensity space. Activation Maps were generated individually for each of the training, validation and test tumors, and these became the inputs on which a Learning Vector Quantizer (LVQ) classifier was trained.
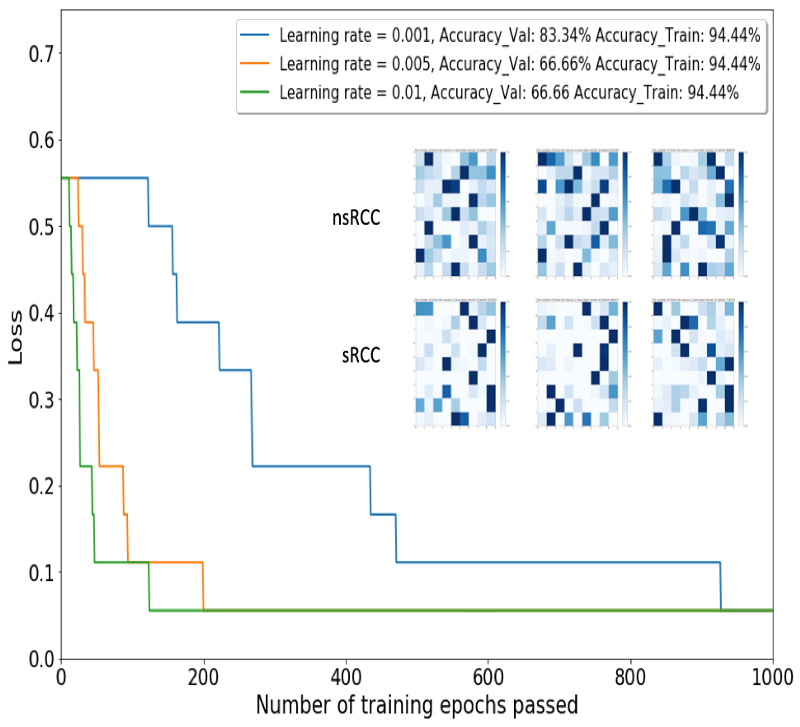
The LVQ was trained on Activation Maps of the 18 training cohort tumors and optimized for step size and number of training epochs.
The model with the best performance (learning rate = 0.001, 1000 training epochs) on Activation Maps of the 6 validation cohort tumors was advanced to the test phase.
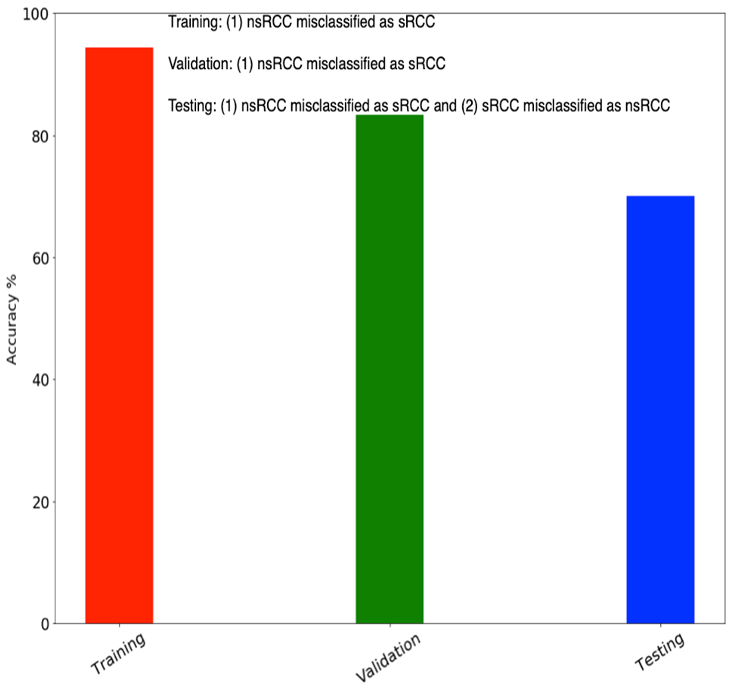
This model produced an accuracy of 70% on the 10 test cohort tumors.